

Why Investors Might Think Twice About Chasing the Biggest Stocks
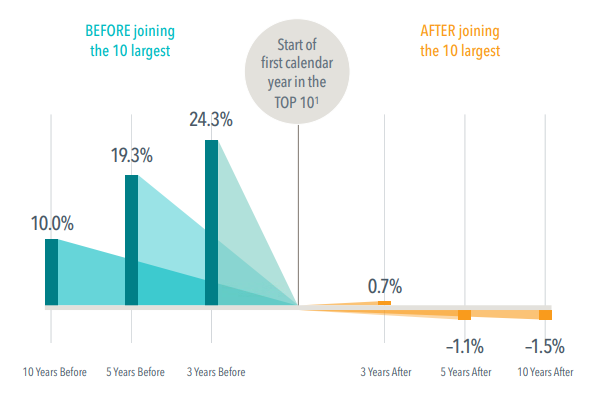
As companies grow to become some of the largest firms trading on the US stock market, the returns that push them there can be impressive. But as the chart below shows, not long after joining the Top 10 largest by market cap, these stocks, on average, lagged the market.
From 1927 to 2019, the average annualized return for these stocks over the three years prior to joining the Top 10 was nearly 25% higher than the market. In the three years after, the edge was less than 1%.2 Five years after joining the Top 10, these stocks were, on average, underperforming the market—a stark turnaround from their earlier advantage. The gap was even wider 10 years out.
The Bottom Line: Expectations about a firm’s prospects are reflected in its current stock price. Positive news might lead to additional price appreciation, but those unexpected changes are not predictable.
Average Annualized Outperformance of Companies Before and After the First Year They Become One of 10 Largest in U.S.
Compared to Fama/French Total US Market Research Index, 1927-2019
1. Ten largest companies by market capitalization.
2. Returns are measured as of start of first calendar year after a stock joins Top 10
Source: Dimensional Fund Advisors
Past performance is no guarantee of future results. Indices are not available for direct investment; therefore, their performance does not reflect the expenses associated with the management of an actual portfolio. This information is intended for educational purposes and should not be considered a recommendation to buy or sell a particular security. Named securities may be held in accounts managed by Dimensional.
In USD. Source: Dimensional, using data from CRSP. Includes all US common stocks excluding REITs. Largest stocks identified at the end of each calendar year by sorting eligible US stocks on market capitalization. Market is represented by the Fama/French Total US Market Research Index. Annualized Excess Return is the difference in annualized compound returns between the stock and the market over the 3-, 5-, and 10-year periods, before and after each stocks’ initial year-end classification in the top 10. 3-, 5-, and 10-annualized returns are computed for companies with return data available for the entire 3-, 5-, and 10-year periods respectively. The number of firms included in measuring excess returns prior (subsequent) to becoming a top 10 stock consists of 38 (53) for 3-year, 37 (52) for 5-year, and 29 (47) for 10-year. Fama/French Total US Market Research Index: The value-weighed US market index is constructed every month, using all issues listed on the NYSE, AMEX, or Nasdaq with available outstanding shares and valid prices for that month and the month before. Exclusions: American Depositary Receipts. Sources: CRSP for value-weighted US market return. Rebalancing: Monthly. Dividends: Reinvested in the paying company until the portfolio is rebalanced. Eugene Fama and Ken French are members of the Board of Directors of the general partner of, and provide consulting services to, Dimensional Fund Advisors LP. Dimensional Fund Advisors LP is an investment advisor registered with the Securities and Exchange Commission.
Interested in learning more? Please connect with us.
The author does not intend to provide investment, legal or tax advice as these materials are for general educational purposes only. Please consult your legal, tax or investment professional for advice on your particular situation. This material is derived from sources believed to be reliable, but its accuracy and the opinions based thereon are not guaranteed. It is not intended to be a solicitation, offer or recommendation to acquire or dispose of any investment or to engage in any other transaction. Investing involves risk including the possible loss of principal. Past performance does not guarantee future results. Please refer to RRCM’s Form ADV Part 2 for additional disclosures regarding RRCM and its practices.