

Our Thoughts on a Volatile Market
The blog below was updated on Tuesday, April 8th. Since then, the Trump administration has announced a change in tariff policy, causing a near 10% rally for US stocks on Wednesday, April 9th. As we know, markets adjust to new information quickly, reinforcing our point of sticking to a long-term discipline and not trying to time markets.
The Market's Reaction to Trump's Tariff Policies
The S&P 500 fell 10.5% over last Thursday and Friday (April 3rd and 4th), which was the largest 2-day decline in decades. The S&P is now down about 15% year to date (through 4/8/25). From its peak in February, the S&P 500 is close to bear market territory (a loss of 20% from a high point).1
The selloff over the last two days is a direct result of the administration’s tariff policies, which were much broader and deeper than expected. Investors fear the prospect of a global trade war. China has now retaliated with a new tariff on US goods, and the odds of a recession have increased.
Prospects for further rate cuts by the Fed have increased. With some traders betting that we will see four rate cuts this year, others feel the prospect of higher tariff induced inflation may cause the Fed to move slower. Amidst all this news, we had the March jobs report showing solid employment growth, higher than expected, but this is getting lost amidst the shuffle.
As of now, there is little clarity on how the tariff situation will play out over the months ahead. The hardline stance of the administration may be a bargaining position. Policies could change quickly, which would be positive. Negotiations could take much longer, which would heighten the possibility of a recession and further market losses. There is also a risk that the hardline on tariffs stays in place. For now, investors are selling first and asking questions later.
Our Thoughts and Response
We remain committed to our principle of long-term thinking. It is not a case of being stubborn or inflexible. It’s simply following long accepted research that trying to time markets is not an effective strategy. We are going to maintain discipline. The most important effort we can make on behalf of our clients is following a financial plan to meet their long goals over decades - not attempting to get in and out of the markets based on the news of the day.
I spoke with one of our clients on Friday, and he crystallized our thinking with this simple statement. "The downturn is a problem for those that need to sell stocks right away. You have positioned me to have years of cash and bonds, so I will not need to touch my stocks for years."
He's right. Abandoning a long-term plan by selling stocks in essence locks in recent losses. In a taxable account, that may also mean generating capital gains taxes, as the markets have done so well over the last several years. Further, it creates a second decision that needs to be made--when to get back in. The odds of timing both decisions correctly (when to sell and when to buy back) is pretty tough. The odds are against you.
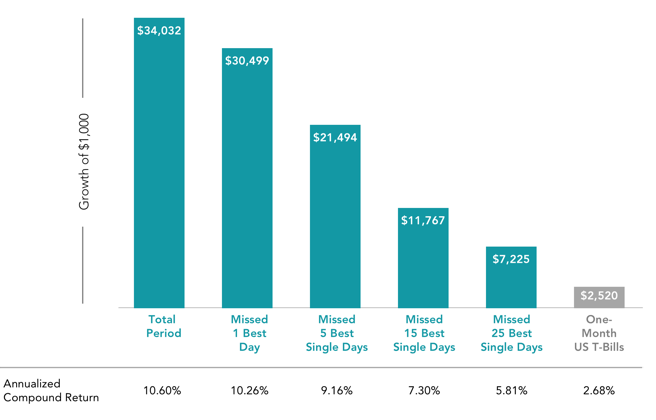
Attempting to time the market to avoid the worst days could cause an investor to miss out on some of the best days (see Chart 1 below). Consider that $1,000 invested in the S&P 500 Index back in 1990 would have grown to $34,000 by the end of 2024 if left untouched. However, if an investor had pulled their money out and missed the single best day over the more than 30-year period, their ending wealth would be reduced by nearly $3,500. Worse, if an investor had missed the five best single days, their ending wealth would be reduced by more than $10,000. Over the course of decades, even a few days can make a big difference. When do those best days occur? Often in the midst of a downturn.
Chart 1 - S&P 500 Index, 1990 - 2024
 Source: Dimensional Fund Advisors. See Notes Below.
We've had volatile markets before. Since the 2009 low of the Great Financial Crisis, the S&P 500 has corrected by 10% or more 10 times. Each time there has been a unique set of circumstances. David Booth, Chairman of our investing partner Dimensional Fund Advisors, recently penned an op-ed for the Financial Times that offers a reassuring perspective on market uncertainty. David wrote, "History shows us that markets have overcome every previous ‘unprecedented’ challenge. The Great Depression, World Wars, the inflation crisis of the 1970s, Black Monday in 1987, the Great Recession of 2008—markets have weathered them all. Each crisis can feel like the end of the world when it happens, yet the pattern of recovery stays remarkably consistent. Over 50 years of working in finance has consistently shown me two things: We cannot predict the future, but despite that uncertainty, markets have eventually bounced back.”
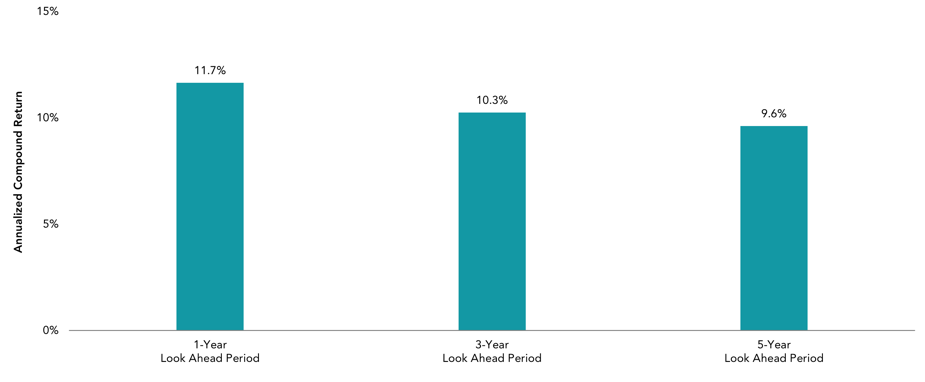
Research shows this to be correct. Chart 2 below shows that after significant market declines, markets do come back. Looking back to 1926, after a decline of more than 10%, the average annualized return of the S&P 500 was almost 10% over the next five years.
Chart 2 - Average Annualized Returns After Market Decline of More Than 10%
S&P 500, January 1926 - December 2024
Source: Dimensional Fund Advisors. See Notes Below.
How long will it be until losses are made up? No one can reliably predict the magnitude of a decline or the time to recovery. In nine out of the sixteen bear markets since 1929, investors who stayed the course made back their losses within a year (see Chart 3 below).
Chart 3 - US Stock Market Declines of 20% or Greater, 1929 - 2024

Source: Dimensional Fund Advisors. See Notes Below.
Diversification is Helping
It's important to remember that not everything is down in line with the US stock market. Diversification is helping.
International stocks are down less than US stocks. Cash and bonds are providing strong positive returns, offering their typical ballast during a rough period. Investors that had loaded up on recent high fliers, the "Mag 7" tech stocks, are feeling the most pain today. Our stock portfolios own thousands of companies, tracking the markets at a low cost.
Focus on What You Can Control
We acknowledge that the downturn may worsen, but we will focus on what we can control.
We will look to take tax losses, if appropriate, using our tax loss harvesting strategy. We will look to rebalance, if appropriate, following our discipline of getting back to the targeted mix of cash, stocks and bonds when the actual allocation gets out of balance.
We encourage clients to focus on what they can control as well. During days like we are currently experiencing, that means sticking with your long-term plan, which is tailored to meet your goals over time and has already incorporated volatile markets along the way.
Most importantly, we are here for you, to make sure you understand our thinking, and answer any questions that you may have.
David is the Co-Founder and Chief Investment Officer of Rappaport Reiches Capital Management. He acts as personal CFO to entrepreneurs and corporate executives, providing organization and clarity in their finances. Please connect with David below. He loves to talk about investing, financial planning, and Aspiritech, a non-profit hiring individuals on the autism spectrum.